

These states love playing the lottery the most
Winning a lottery jackpot is unlikely, but the possibility continues to capture the imagination of people across the United States.
For Powerball, the jackpot odds are 1 in 292 million, making a winning ticket exceptionally unlikely. Still, stories of life-changing prizes keep the dream alive. For some, the lottery represents a chance at greater comfort, freedom from financial worries and a more luxurious life.
Lottery sales have grown as massive jackpots have made headlines. U.S. sales totalled $113.3 billion in 2024, close to twice what Americans spent in 2010.
Lottery enthusiasm varies widely by state. Access to games, income and cultural attitudes can all affect participation. To identify where interest was strongest, we compared search activity and spending intensity across all 50 states.
Key Findings
- U.S. lottery sales reached a record $113.3 billion in 2024, the largest total reported
- Georgia places #1 among U.S. states for lottery interest, supported by the nation’s highest search intensity and the fourth-highest lottery spending per adult, at $629.90. The state’s “all net proceeds fund education” message frames ticket purchases as support for a public cause.
- Massachusetts has the highest spending intensity, at $1,059 per adult, almost twice the national average
- Tennessee and South Dakota have the lowest spending, at $34–$35 per adult
- The annual average American lottery spend is $384 per adult
- Lottery search activity doubles during Christmas week, rising from 15M to 32M searches over the 2024 Christmas season.
- Search interest sees its biggest national surges when jackpots top $1 billion
U.S. States with the Highest Lottery Engagement
The ranking uses two indicators of lottery interest in the United States. Search volume reflects curiosity and intent, while spending intensity per adult shows how much residents spend on tickets. Together, these measures highlight states with especially strong lottery interest and ticket spending.
America’s 5 States Most Obsessed with the Lottery
#1 Georgia: Education Funding and the Nation’s Lottery Capital
Georgia ranks first in lottery interest. Residents generate the nation’s highest search interest, averaging 0.48 monthly searches per adult. Ticket spending is also close to twice the national average, putting Georgia at the top for overall lottery engagement in the United States.
Revenue from the Georgia Lottery supports the HOPE Scholarship and Pre-K programs, a link promoted throughout the state. This public message can make buying a ticket feel like a contribution to education. Connecting play with community benefits may also make lottery spending seem more accepted and routine.
#2 Michigan: An Early Shift to Digital Lottery Play
Michigan was an early U.S. adopter of online lottery platforms, building a player base accustomed to buying tickets digitally. That history helps explain the state’s high search and spending figures. Residents spend $556 per adult, well above the national average of $384.
#3 Massachusetts: Scratch-Off Leader with the Highest Adult Spending
Massachusetts leads the nation in annual lottery spending, at $1,059 per adult, as residents try their luck. Scratch-off tickets are a particularly large part of the market, with per-capita sales twice those of other states. Frequent purchases help explain the high spending figure. The state also reports a high return to players: 73.4% of revenue was returned in 2024, a figure that may contribute to player confidence.
#4 Delaware: A Small State with Substantial Lottery Spending
Delaware has fewer than 1 million adults, yet lottery spending per adult is above average at ($493). Together, these figures point to notable participation in a small population. Early adoption of online lottery play has also helped make lottery games familiar across generations.
#5 Connecticut: High Household Incomes and Lottery Interest
Connecticut has one of the highest median household incomes in the U.S., and combines strong search interest with spending of $549 per adult. These measures place the state fifth in the lottery engagement ranking.
What Search Data Reveals About Lottery Fever
Ticket sales show how much people spend, while search trends help reveal when and why lottery interest rises. The data points to several familiar events that regularly prompt people to look for lottery information.
Record Jackpots Renew Public Interest
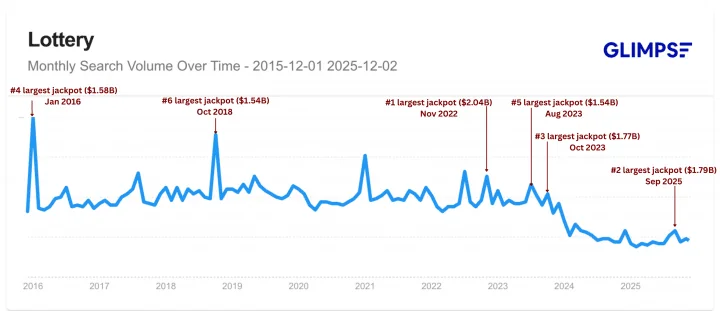
Few events draw lottery searches like a record-breaking jackpot. When a prize reaches historic proportions, public interest tends to rise with it.
On November 7, 2022, Edwin Castro won the largest lottery jackpot to date, worth $2.04 billion. As the drawing approached, search interest more than doubled from the level a month earlier: 32 million monthly searches compared with a peak of 70.2 million.
On September 6, 2025, Powerball produced the largest jackpot to date, $1.8 billion, shared by two winners. Search interest again more than doubled ahead of the drawing, climbing from a 15 million baseline the month before to a peak of 37 million.
The drawing for the third-largest jackpot in U.S. history took place on October 12, 2023. One winning ticket claimed $1.765 billion. Before the result, searches rose from 30 million to 43.68 million.
These examples show search interest climbing as U.S. jackpots pass the $1B mark. Big prizes are not the only draw, however: holiday traditions also bring extra attention to lottery games.
Christmas Doubles Lottery Searches
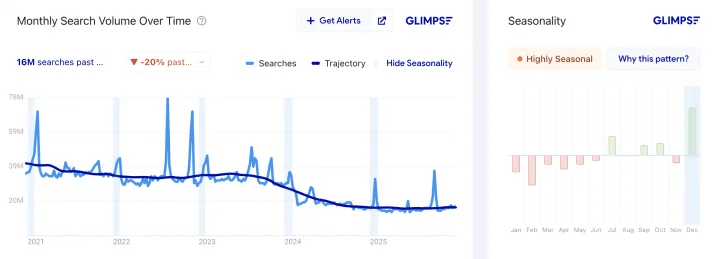
Unlike jackpot-related spikes, which can happen at any time, lottery searches follow a seasonal pattern. Activity generally slows in late winter and spring before picking up again as Christmas approaches.
For many Americans, lottery tickets have become part of holiday routines shaped by nostalgia and family. During Christmas week in 2024, related searches reached 32 million, up from 15 million the month before. That 2.1-fold increase was the year’s biggest seasonal jump.
Holiday scratch-off campaigns, year-end rollovers and the tradition of giving tickets as gifts are among the factors that may drive this seasonal rise.
Methodology
We compared lottery engagement across U.S. states using search interest and ticket spending per adult. The index covers only states with complete, available data: 35 states publish 2024 lottery sales, while three states do not operate lotteries.
Data Sources
- Adult population figures came from the U.S. Census Bureau.
- Google Search Volume represents monthly searches related to lotteries.
- Ticket sales figures came from the latest publicly available 2024 sales data in individual state lottery reports
Metrics Calculated
- Search intensity = state search volume divided by its adult population
- Spending intensity = state ticket sales divided by its adult population
How We Normalized the Data into an Index
We converted both measures into z-scores to show how each state compared with the state average. A positive score indicates above-average interest or spending; a negative score indicates a below-average result. We combined the two scores to create the final engagement index and ranking. See the full dataset for all results.
.
Evan Carrington brings more than 12 years of experience in the iGaming industry, specializing in online casino reviews, slot game analysis, and player safety assessments. Their expertise includes casino licensing, RTP, volatility, bonus terms, and withdrawal policies. Combining hands-on reviews with independent research, Evan provides clear, evidence-based coverage to help players understand gambling platforms, their features, and possible risks.